Why is monitoring website traffic important?
Monitoring website traffic allows you to identify what attracts visitors' attention and what repels them. By tracking where your visitors come from, how much time they spend on specific pages, and what actions they take, you can tailor your website content and functionality to better serve your business goals.
In addition to increasing conversions, monitoring website traffic also helps you understand the effectiveness of your marketing campaigns. By comparing the amount of traffic before and after launching the campaign, you can easily assess its impact on interest in the website. Statistics show that campaigns well tailored to the expectations and needs of visitors can increase website traffic by up to 200%.
Errors in traffic monitoring may lead to misinterpretations of data, which in turn may result in suboptimal decisions. For example, not including bot traffic in your analysis may overestimate actual user engagement. Therefore, it is important to use filtering tools and analyze data in context to avoid confusion.
What are the different types of user monitoring tools?
Depending on your needs, you can choose tools focused on traffic analysis, tracking user behavior, or monitoring website performance. Each type of tool offers unique insights that can help you optimize your online presence.

Website traffic analysis tools
Traffic analysis tools such as Google Analytics allow you to collect and analyze large amounts of data about your website visitors. They provide information about the number of visits, traffic sources, geographical location of users, and the devices they use.
For example, knowing that 60% of your traffic comes from search engines, you may decide to increase your SEO efforts. One mistake is not paying attention to downward trends in traffic from specific sources, which may indicate optimization or competition problems.
Tools for tracking user behavior
Tools like Hotjar and Mouseflow allow you to track in more detail how users interact with your website. You can see where people click the most, what navigation paths are taken, and even watch recordings of user sessions.
This knowledge is invaluable when designing a user interface. For example, if you notice that users are having difficulty finding the buy button, this could be a sign to improve its placement. Missing these insights can result in missing out on potential conversions.
Overview of types of user monitoring tools
Google Analytics – key to analyze website traffic

Let's start with how Google Analytics can help you understand where your visitors are coming from. This tool gives you the ability to track traffic sources, whether from search engines, social media, direct visits, or advertising campaigns. This knowledge is extremely valuable because it allows you to identify the most effective traffic acquisition channels. Companies that analyze and adapt their marketing strategies based on this data often experience traffic increases of up to 60-70%.
Another important aspect that Google Analytics allows you to pay attention to is the bounce rate, i.e. the percentage of users who left the website after viewing only one page. Analyzing this indicator in the context of individual pages can indicate which of them do not meet visitors' expectations. Actions to reduce the bounce rate, such as improving content quality or page loading speed, often lead to increased engagement and conversions.
Google Analytics also allows you to monitor goals such as newsletter subscriptions, e-book downloads, or purchases made. This allows you to accurately track what marketing activities and what content on your website converts best, which is invaluable when optimizing your marketing campaigns and budget.
Therefore, to effectively use the potential of Google Analytics, it is important to regularly analyze and interpret the collected data. This will ensure that your website and marketing strategy is continually adapted and improved, ultimately contributing to increased traffic, improved user engagement and increased conversions.
Hotjar – understand the behavior of your users

Hotjar is a tool that allows you to see how visitors move around your website, what they click on, and what areas attract their attention. This allows you to identify website elements that are attractive to users and those that may require improvement.
One of Hotjar's main features are heat maps, which visualize where users are most likely to click, scroll, and pause on a page. Heat map analysis can show that users are focusing their attention on specific sections of the page, giving valuable clues as to where to place the most important information or offers. Statistics show that optimizing the arrangement of the most important elements on the website can increase conversions by up to 30%.
Hotjar also offers recordings of user sessions, so you can see how real people interact with the site. This may reveal navigation problems that were not previously obvious. For example, if many users make the mistake of clicking on elements that are not links, this could be a signal to redesign them. Companies that use session recordings to optimize user experiences often see an increase in customer satisfaction.
However, it is important not to rely solely on one tool to analyze user behavior. Hotjar provides valuable insights, but the best results are achieved when combined with other analytics data and A/B testing. Some companies make the mistake of interpreting Hotjar data out of context, which can lead to inappropriate conclusions.
Adobe Analytics – advanced analytics for professionals

Adobe Analytics is an analytical tool intended for professionals that offers advanced data analysis capabilities. With a deep understanding of user behavior and content performance, it enables you to create detailed marketing strategies and optimize websites.
One of the main advantages of Adobe Analytics is its ability to segment users based on various criteria, such as website behavior, demographics, devices used, and traffic sources. This functionality allows you to create precisely targeted marketing campaigns that are more resonant with the expectations and needs of specific target groups. Companies that use this approach often see engagement and conversions increase by over 50% because they are able to deliver more personalized content.
One common mistake in data analysis is relying on a limited set of metrics. Adobe Analytics solves this problem by offering access to a wide range of metrics and the ability to custom configure them. Thanks to this, you can monitor virtually every aspect of user interaction with the website, from navigation paths to detailed conversions. Tailoring metrics to your site's specific needs allows you to more precisely track progress and identify areas that need optimization.
It is also worth paying attention to the integration of Adobe Analytics with other Adobe Experience Cloud tools, which allows for even deeper analysis and personalization of user experiences. By using this integration, you can, for example, use data from Adobe Analytics to create more personalized campaigns in Adobe Target, which translates into better marketing effectiveness.
Mixpanel – detailed traffic and engagement analysis

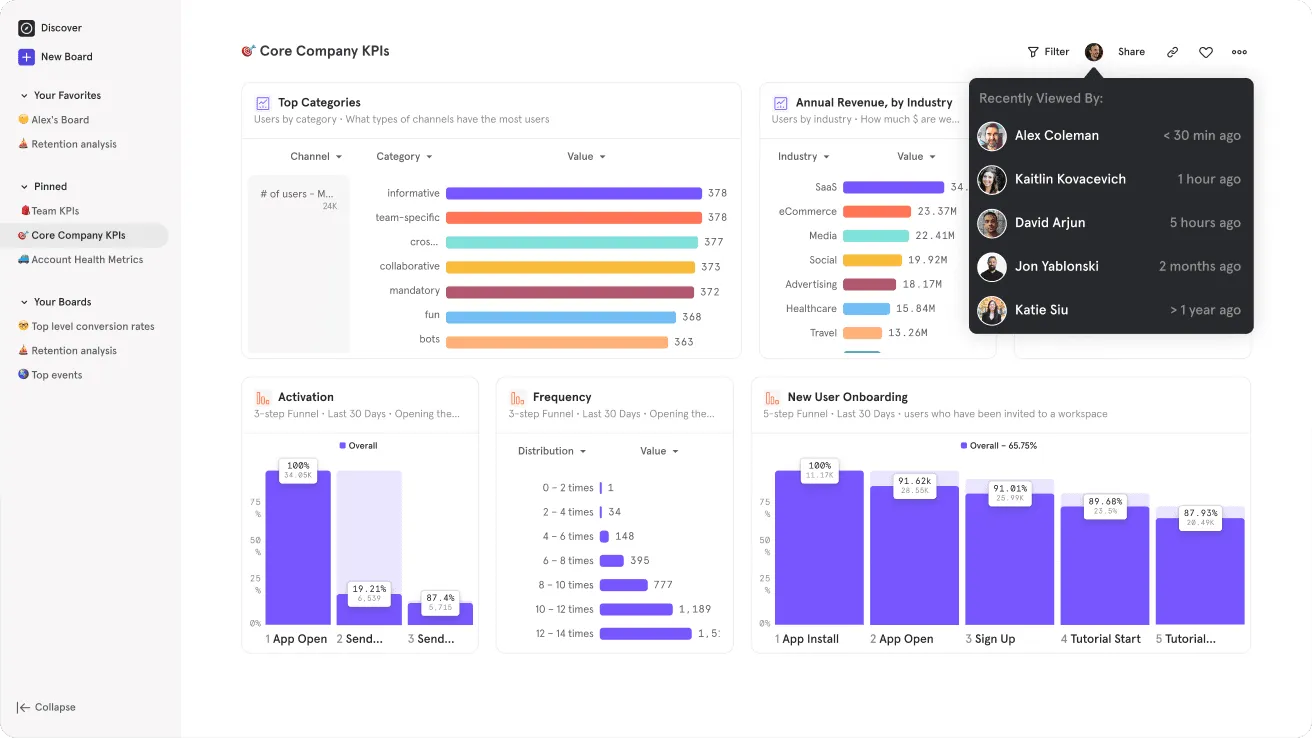
Mixpanel is an analytics platform that allows you to collect, analyze and interpret data about how users interact with your website or app. With Mixpanel, you can more easily understand what attracts your visitors' attention and what elements may need improvement.
With Mixpanel you can track conversions, measure user retention, and analyze what features are most frequently used. This tool also allows you to segment users based on their activities, which is extremely useful in adapting marketing communications and product offers to the needs of different target groups.
Mixpanel also offers the so-called functionality "Event Tracking", i.e. event tracking, which allows you to monitor specific actions performed by users, such as clicks, subscriptions to the newsletter or making a purchase.
When implementing Mixpanel, also remember the importance of testing different versions of your website or application. A/B testing that can be performed using this platform allows you to experiment with different page elements to understand which ones best influence engagement and conversion.
UserTesting – direct feedback from users

UserTesting is a platform that allows you to collect direct feedback from users of your website or application. Thanks to this tool, you can quickly and effectively understand what users think about your product, what they like about it and what needs improvement. This is an invaluable source of information that allows you to tailor the offer to the expectations and needs of the market.
One of the biggest advantages of UserTesting is the ability to observe real users as they use your website or application. Not only do you get their raw feedback, but you also get to see how they navigate, what they pay attention to, and where they encounter difficulties. This is invaluable because we are often unable to notice certain imperfections of our products ourselves.
A mistake companies often make is relying solely on quantitative data, such as page visits or conversion rates. UserTesting adds qualitative data to this picture that is key to understanding “why” users behave the way they do. Remember that behind each indicator there are real people with their own needs and expectations.
When using UserTesting, it is worth paying attention to selecting the appropriate test group. It's not just about being potential customers, but also about making sure their demographic profile and interests best reflect your target audience. This increases the chances that you will receive accurate and useful information.
When developing tests, try to formulate questions and tasks in an open way to encourage users to share their honest opinions and observations. Overly detailed instructions may lead participants to give answers that they consider "expected" rather than sharing their authentic experiences.
Clicky – intuitive real-time tracking and analysis

Clicky is a tool that enables intuitive tracking and analysis of website traffic in real time. Thanks to this, users can get immediate insight into how visitors interact with the website, allowing them to quickly respond to their needs and preferences. Real-time analysis offered by Clicky allows you to observe what content attracts users' attention, where they spend the most time, and what their navigation paths are on the website.
One of Clicky's greatest advantages is its simplicity of use. The interface is intuitive and easy to use, which means that even people with no experience in data analysis can effectively use the available functions. The tool also offers detailed reports that can be tailored to individual needs, which is especially useful for companies looking to understand the specific behaviors and expectations of their customers.
Another benefit of using Clicky is the ability to track conversions and analyze which traffic sources are most valuable to your business. This allows you to optimize your marketing campaigns and focus on those promotion channels that generate the highest return on investment. Additionally, Clicky allows you to track detailed user actions, such as link clicks and page scrolling, giving you a more complete picture of how visitors engage with your content.
Google Search Console – monitor your visibility in the search engine

Google Search Console is a free tool offered by Google that allows you to monitor and maintain your website's presence in Google search results. It is often an essential resource for website owners, marketers and SEOs to understand how Google sees their website and how they can improve its visibility and ranking.
Using Google Search Console, users can check which pages are indexed by Google, identify indexing errors, and analyze web search traffic. This tool also gives you the opportunity to check which queries lead users to your website and how often your website appears in search results.
A very important aspect of using Google Search Console is regular monitoring and solving indexation problems. These issues may include duplicate content, missing title tags, or descriptions that are not optimal for SEO. Responding quickly to such problems can significantly impact the website's visibility in search results.
Another common mistake is to ignore the improvement reports that Google Search Console offers. This tool provides valuable tips on how to improve website usability on mobile devices, optimize page loading speed and increase accessibility for users. These activities not only improve the user experience, but can also contribute to better ranking in search results.
Mouseflow – user interactions with the website

Mouseflow is an analytics tool designed to accurately track and analyze how users interact with a website. By recording user sessions and creating heat maps, website owners can understand what areas attract visitors' attention, where they click, and which elements may cause frustration or navigation problems.
One of the main advantages of Mouseflow is the ability to visualize data. Heat maps show where users most often point their mouse cursor at on a page, where they click, and how far they scroll. This information is extremely valuable in optimizing your page layout and content to better serve your business goals and users.
It is also very important to understand why users may decide not to continue browsing the site or do not convert. Mouseflow allows you to identify the so-called "bottlenecks", i.e. places that most often result in the user leaving the website. Recognizing and resolving these issues can significantly improve your site's retention and conversion performance.
One mistake that can be made when using Mouseflow is to focus solely on single metrics, such as the number of clicks, without a deeper understanding of the context of these actions. It is important to analyze data in a holistic way, taking into account user navigation paths, time spent on the website and interactions with various elements, such as forms or call-to-action buttons.
Mouseflow also allows you to create recordings of user sessions, which is like watching over your shoulder as your visitors move around the site. Analyzing these recordings can provide invaluable insight into how users actually experience the site, revealing both points of strength and areas for improvement. Seeing how real people use the site can help identify inconsistencies between how designers anticipated the site would be used and reality.
Optimizely – optimization of user experience

Thanks to advanced tools for A/B testing and content personalization, Optimizely allows you to precisely adapt interfaces and functionalities to the needs and preferences of users. By using data and statistics, you can significantly improve engagement, satisfaction and conversions on your website or app.
One of the most important benefits of using Optimizely is the ability to perform A/B testing without deep programming skills. The platform offers an intuitive drag-and-drop interface that allows you to create and implement different versions of a page or page elements to see which ones best meet user expectations.
It is very important that before testing begins, we clearly define the goals we want to achieve and the metrics we will use to evaluate the results. Inadequate definition of these elements may lead to misinterpretation of data and inappropriate decisions. Appropriate goals and metrics should be closely related to key business performance indicators (KPIs), such as conversion rate, average time on page or bounce rate.
Summary and next steps
There are many tools available on the market, and although each is different, we can distinguish three groups: page visits, heat maps and A/B tests. Each tool has slightly different specifics than its competitors, but ultimately they are all designed to provide you with data to increase conversions.
We use Google Search Console, Google Analytics and Hotjar to optimize the website you are currently reading this article on. In my opinion, it is a toolkit that provides quite a lot of data in various categories. They have both heat maps and the number of entries, you can do a lot.
I recommend trying these tools, but only practice will tell whether they will work for you. By reading subsequent guides you will only learn what works for others. Don't wait and see what works for you!

Adam Naworski


